What are the Switching Tools available on the MikroTik switch?

When you want to diagnose Layer 2 problems, you require to use some tools that MikroTik RouterOS offers to us. In this course, we have passed through most of the tools, so you can consider this chapter just like a refresher of what we have seen previously as tools.

Switch Stats

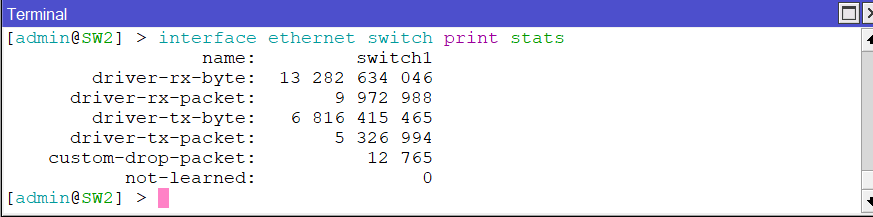
You can view the reporting statistics that the switch chip is providing by using the below command. This is useful so you can monitor how many packets are being sent to the CPU from the switch chip.

Bridge Filter Stats

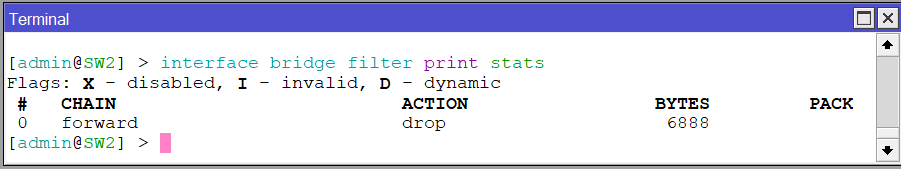
In case you have bridge filter rules that you have created, using this command will show you how many packets/bytes are matched by those rules.

[mepr-show rules=”319″ unauth=”message”] 

Bridge VLAN Table

This is something we have seen it during the course, the Bridge VLAN Table shows you the ports to VLAN mappings once you create the VLAN’s and you assign to them ports as tagged or untagged.

Bridge Ports

If you want to know the interfaces roles for the spanning-tree, you can go to the Bridge Ports. There you can see the role of the interfaces inside the bridge whether they are Designated port, root port, Alternate or disabled. Also, you can see which ports are inside this bridge.


Bridge Hosts Table

In this table you can see the MAC addresses that are learned on the bridge ports and the VLAN IDs that are associated with them in case you are applying VLANs in your network.

IP ARP Table

In this table, you will see all ARP entries learned in the switch.

Interface Stats and Monitoring

If you want to monitor 1 particular interface on the switch to see for example if it is up, what speed is set to it, if it is full duplex and so on, you can write the following command:

There is also a possible way to monitor all interfaces at the same time. You can use the following command:

Port Mirror

In case you want for example to sniff some Layer 2 traffic, you can copy all traffic from one to another port where you can apply the traffic capturing – this is called Port Mirroring. With Port Mirroring you mostly use a capture software such as Wireshark where you can capture the traffic.

Port Mirror working in the switch chip that means that the Mirror-Source that is the port that you want to copy its traffic and Mirror-Target which is the port where you wish to capture this traffic should be on the same switch chip. To apply the Port Mirror is very easy, you need to go to the Switch tab and there select the Mirror Source and Mirror Target as following:

Sniffer (and Torch)

If you want to use packet sniffer or torch tools with an HW-offloaded bridge, then you will see only input/output traffic like broadcast/multicast. That means you will not be able to sniff the normal traffic because remember the traffic is not going to the CPU and the sniffing can see only traffic going to the CPU.

To be able to sniff all traffic with HW-offloading we need to use ACL rules to copy the traffic to the CPU, then we are able to sniff. Copying the traffic to the CPU will not affect the original packet forwarding but it can cause an extra CPU load to process this packet.

Let me show you how you can create the rule to copy the traffic to the CPU:

Now if you do torch or sniffing, you will be able to capture all traffic passing on Ether1.

Logs

A Log is a tool that I personally use a lot when I have issues. It just gives me some valuable information so I can know where the problem is. You can also send all the logs to an external Syslog server in case you wish to save them somewhere else. Checking the logs is very easy, you just need to go to Log and see the logging there.

As you can see, my logging is showing me on my switch that I have excessive or late collision on Ether2 which could be a link duplex mismatch, then now I can address the problem and solve it. Of course I should change also the date/time because it is set to year 1970 which is not good.

SNMP

The RouterOS supports SNMP which is a protocol that is used for monitoring. If you want a free-of-charge software to monitor all your network, you can use MikroTik the Dude software which is free of charge and it works on SNMP. This software will show you graphically how your network is connected and will poll information from all devices and show to it on The Dude.

This is all you need to do about the Tools in this course, I hope you enjoyed it and I see you in the upcoming chapter.

[/mepr-show]

Course Content

0 Comments

Submit a Comment

Your email address will not be published. Required fields are marked *


The reCAPTCHA verification period has expired. Please reload the page.

About